
56
|
WINTER 2017
RESEARCH, EDUCATION & MEDICINE
RESEARCHER PROFILE
How does the study of gene expression complement
other research being done to help understand the
causes of DCS?
The identification of decompression-induced bubbles as
a trigger for DCS is unquestionably important. The most
obvious advantage of gene expression analysis is the
opportunity to look into complex biological processes at
a detailed level.
The process of altering gene expression is always
controlled by one or more so-called transcription factors,
which have been thoroughly mapped over decades.
In general, we now understand what activates any
particular factor in a cell. Once we observe some pattern
of gene expression, we may be able to work backward to
determine the cause of those changes. This may allow
us to better understand which specific environmental
factors are involved in the response observed.
Transcriptomics (study of transcriptome and
their function), together with other “-omics” such as
proteomics (study of proteins) and metabolomics (study
of chemical processes and metabolites in cells), helps us
understand cellular biology and physiology. This may
eventually provide keys to targeted treatment of DCS.
Do breath-hold and scuba diving affect the immune
system differently?
Both breath-hold and scuba diving (but probably
not long saturation diving) appear to affect the
immune system in similar ways. Oxygen is a
common denominator; it is vital fuel for all cells that
contain mitochondria, the organelles responsible
for cellular respiration and energy production. The
oxygen-triggered responses we see may play a role in
susceptibility to DCS.
Both breath-hold and scuba diving cause pronounced
shifts in RNA transcription patterns characteristic of
specific leukocytes (white blood cells involved in the
immune system). We see downregulation of cytotoxic
lymphocytes, CD8+ T lymphocytes (that destroy
targeted cells) and natural killer (NK) cells, and we
see upregulation of genes expressed by neutrophils,
monocytes and macrophages.
We see persistent changes in experienced scuba divers,
and these changes are still measureable at least two weeks
after their last dive. The nature of the changes we found
— i.e., the total pattern of genes that were differently
expressed — led us to conclude that the divers were in a
lasting biological state of defense against oxidative stress.
It is possible that extensive diving may cause persistent
changes in pathways controlling apoptosis (programmed
cell death), inflammation and innate immune responses.
It remains unresolved whether breath-hold diving alters
the immune system’s defensive function. Data suggest
that defensive responses that resolve inflammation
and limit cell toxicity promote physiological balance in
healthy athletes.
What are some challenges you face in interpreting
and applying your results?
As long as you know which cell types you are studying,
transcriptome analysis allows room to interpret data
without a predetermined hypothesis. You have to
consider thousands of genes, however, to make sense of
the actual biology. Good software tools are available for
gene expression analysis, but the challenge is determining
which transcriptome data to use with these tools.
Although the software is based on everything we
already know about the activity of every gene we
consider, most research on human transcriptomes is
concerned with diseases such as cancer or diabetes.
The way genes are expressed in these disease states is
not always relevant to diving. We spend an incredible
amount of time poring over scientific reports to make
sense of the patterns in our data and then constructing a
coherent profile.
What insights might the research and dive
communities gain from your work?
Norway has a very long coastline, and most of its major
industries relate to the ocean. Offshore oil companies
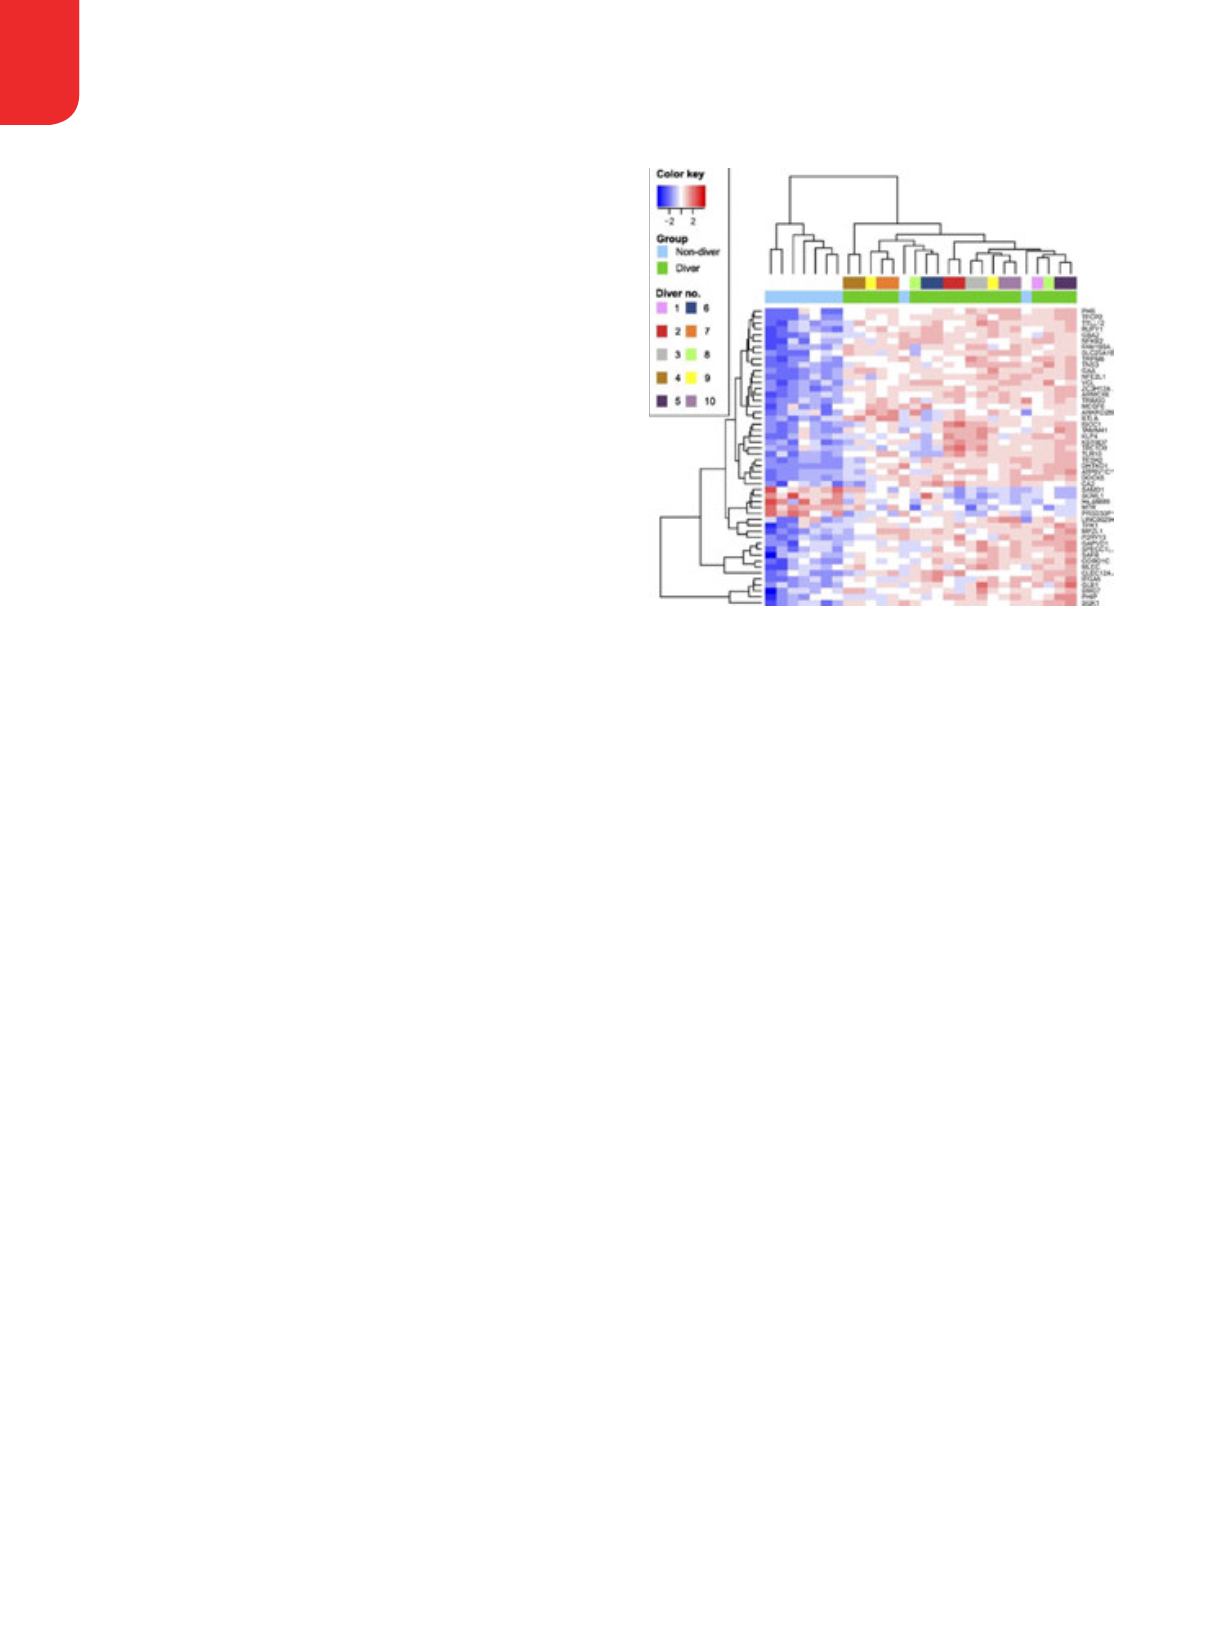
This heat-map visualization shows messenger RNA (mRNA) levels
for the top-50 differentially expressed genes in the stationary blood
transcriptomes of 10 divers compared with those of nine nondivers.
The columns show individual divers, while the rows show genes. Red
indicates upregulation, and blue indicates downregulation.


